![]()
Free Server Monitoring with PRTG
Track uptime, health, disk space, and performance 24/7
- Eliminate network strain and server bottlenecks
- Easily identify issues using a central dashboard
- Be notified with real-time alerts via SMS, email, and more
Our users give top ratings for monitoring with Paessler PRTG


PRTG free server monitoring: What you'll find on this page
PRTG makes server infrastructure monitoring as easy as it gets
Custom alerts and data visualization let you quickly identify and prevent hard disk health, server performance, and storage issues.
Why to choose PRTG for server monitoring
Server monitoring is our passion. And we always let you try it for free.
![]()
Server health monitoring
Paessler PRTG monitors every key health parameter of your servers, including hardware status, disk space, CPU load, and more. Get full control over all your physical & virtual servers and save time that you can use for other important tasks.
![]()
Web server monitoring
PRTG monitors your web servers and websites to make sure that your company’s web presence is always up & running. Our sensors keep a constant eye on the availability, traffic, and processes of your web pages.
![]()
Server availability
Server availability is business critical for every company. One small glitch can not only trigger a lot of complaints, but also affect your whole business & IT infrastructure. With PRTG, you can make sure that all servers are working as expected.
Free server monitoring vs. licensed editions
![]()
Server monitoring freeware
- 100 sensors free for life (enough for basic server monitoring)
- For each device about 10 sensors required on average
- Alarm, mapping, and report features included
- Freeware edition sufficient for most small networks
![]()
PRTG licenses
- Flexible licenses with 500 to 10,000 sensors
- Monitor 50 to 1,000 devices or more
- Easily upgrade if more sensors are required
- Existing monitoring unchanged with upgrade
- Try full version free for 30 days
“All-around winning “The real beauty of PRTG is the endless possibilities it offers” “PRTG Network MonitorIT experts agree: Paessler PRTG is a great solution for IT infrastructure monitoring

network monitor”

is very hard to beat”
What all-in-one server monitoring looks like in PRTG
Diagnose network issues by continuously tracking your servers. Show disk usage, server performance, downtime, and other key metrics in real time. Visualize monitoring data in clear graphs and dashboards to identify problems more easily. Gain the network visibility you need to troubleshoot issues with server functionality.
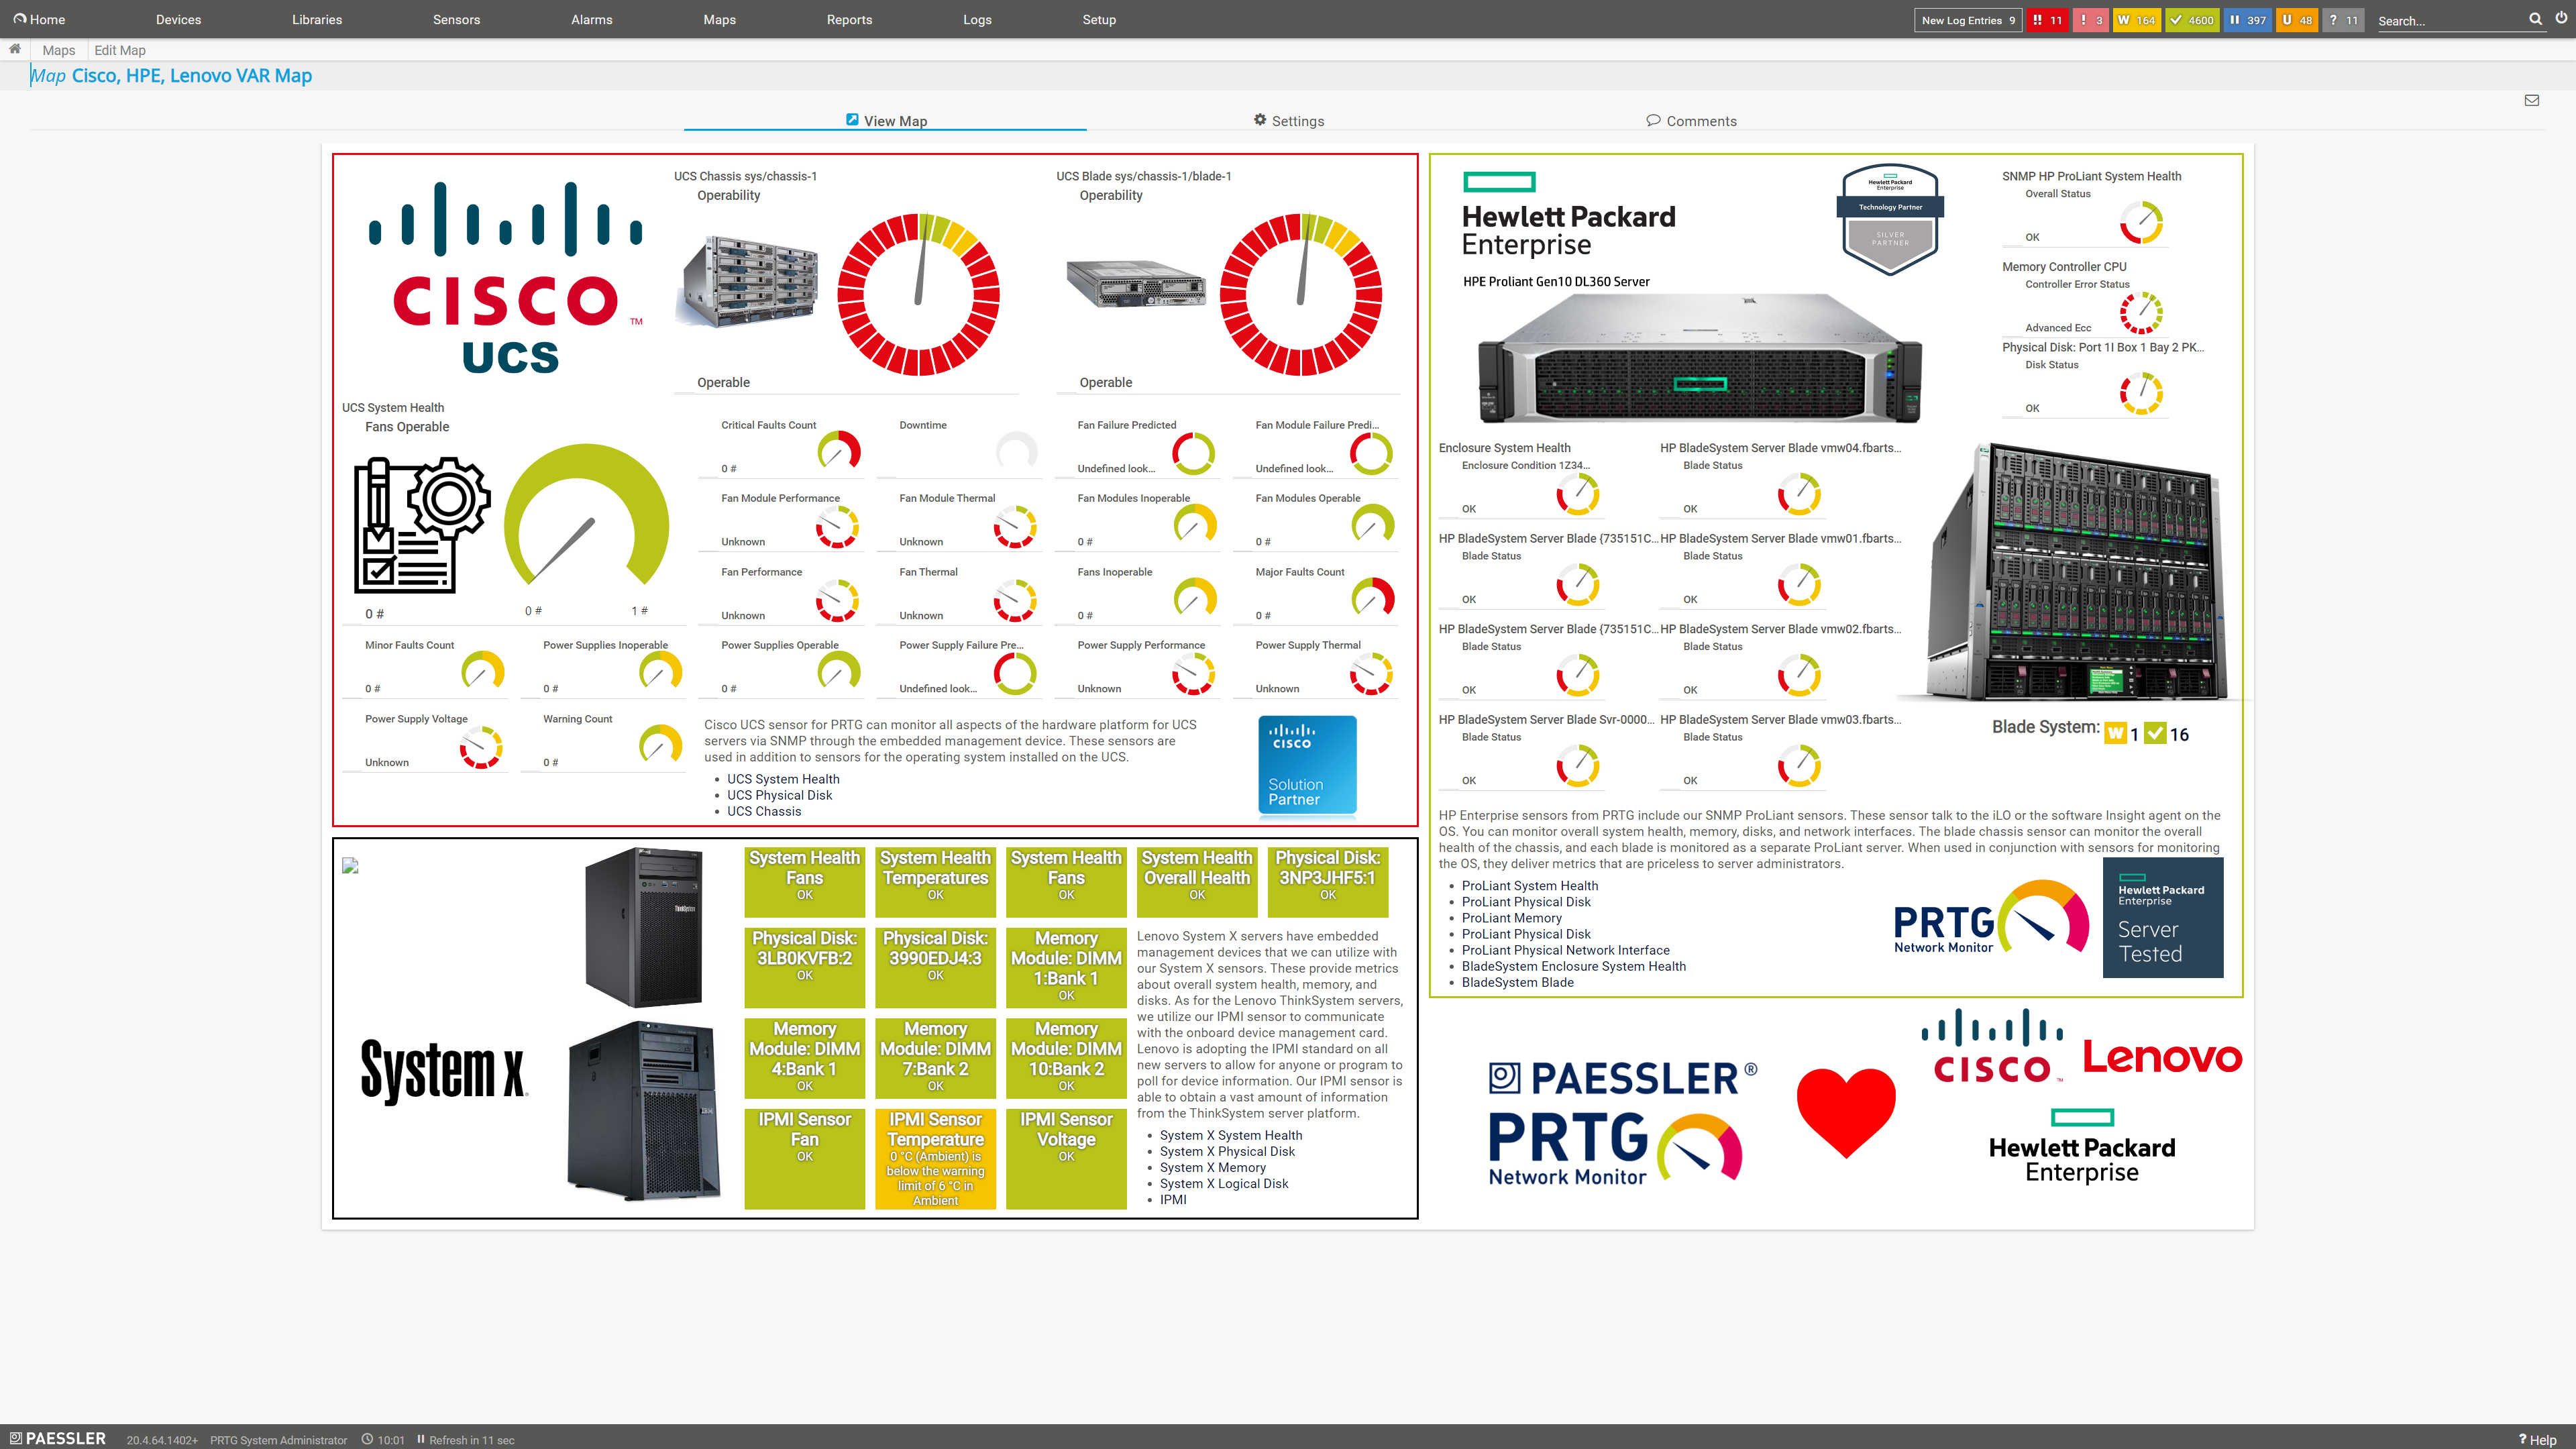
Custom dashboard for server hardware monitoring
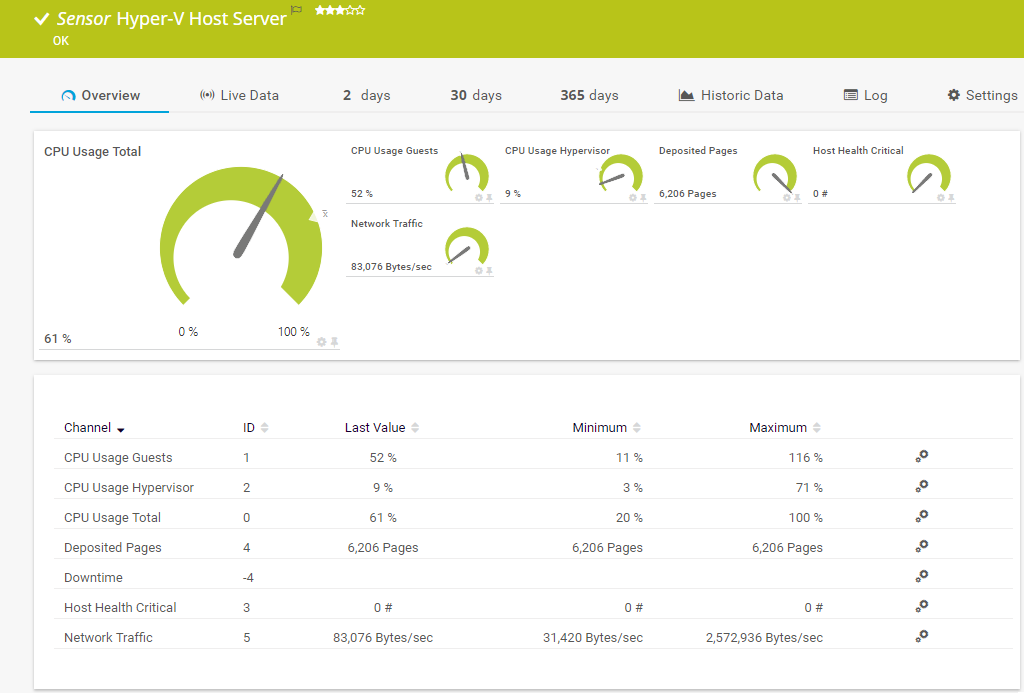
PRTG Hyper-V Host Server sensor
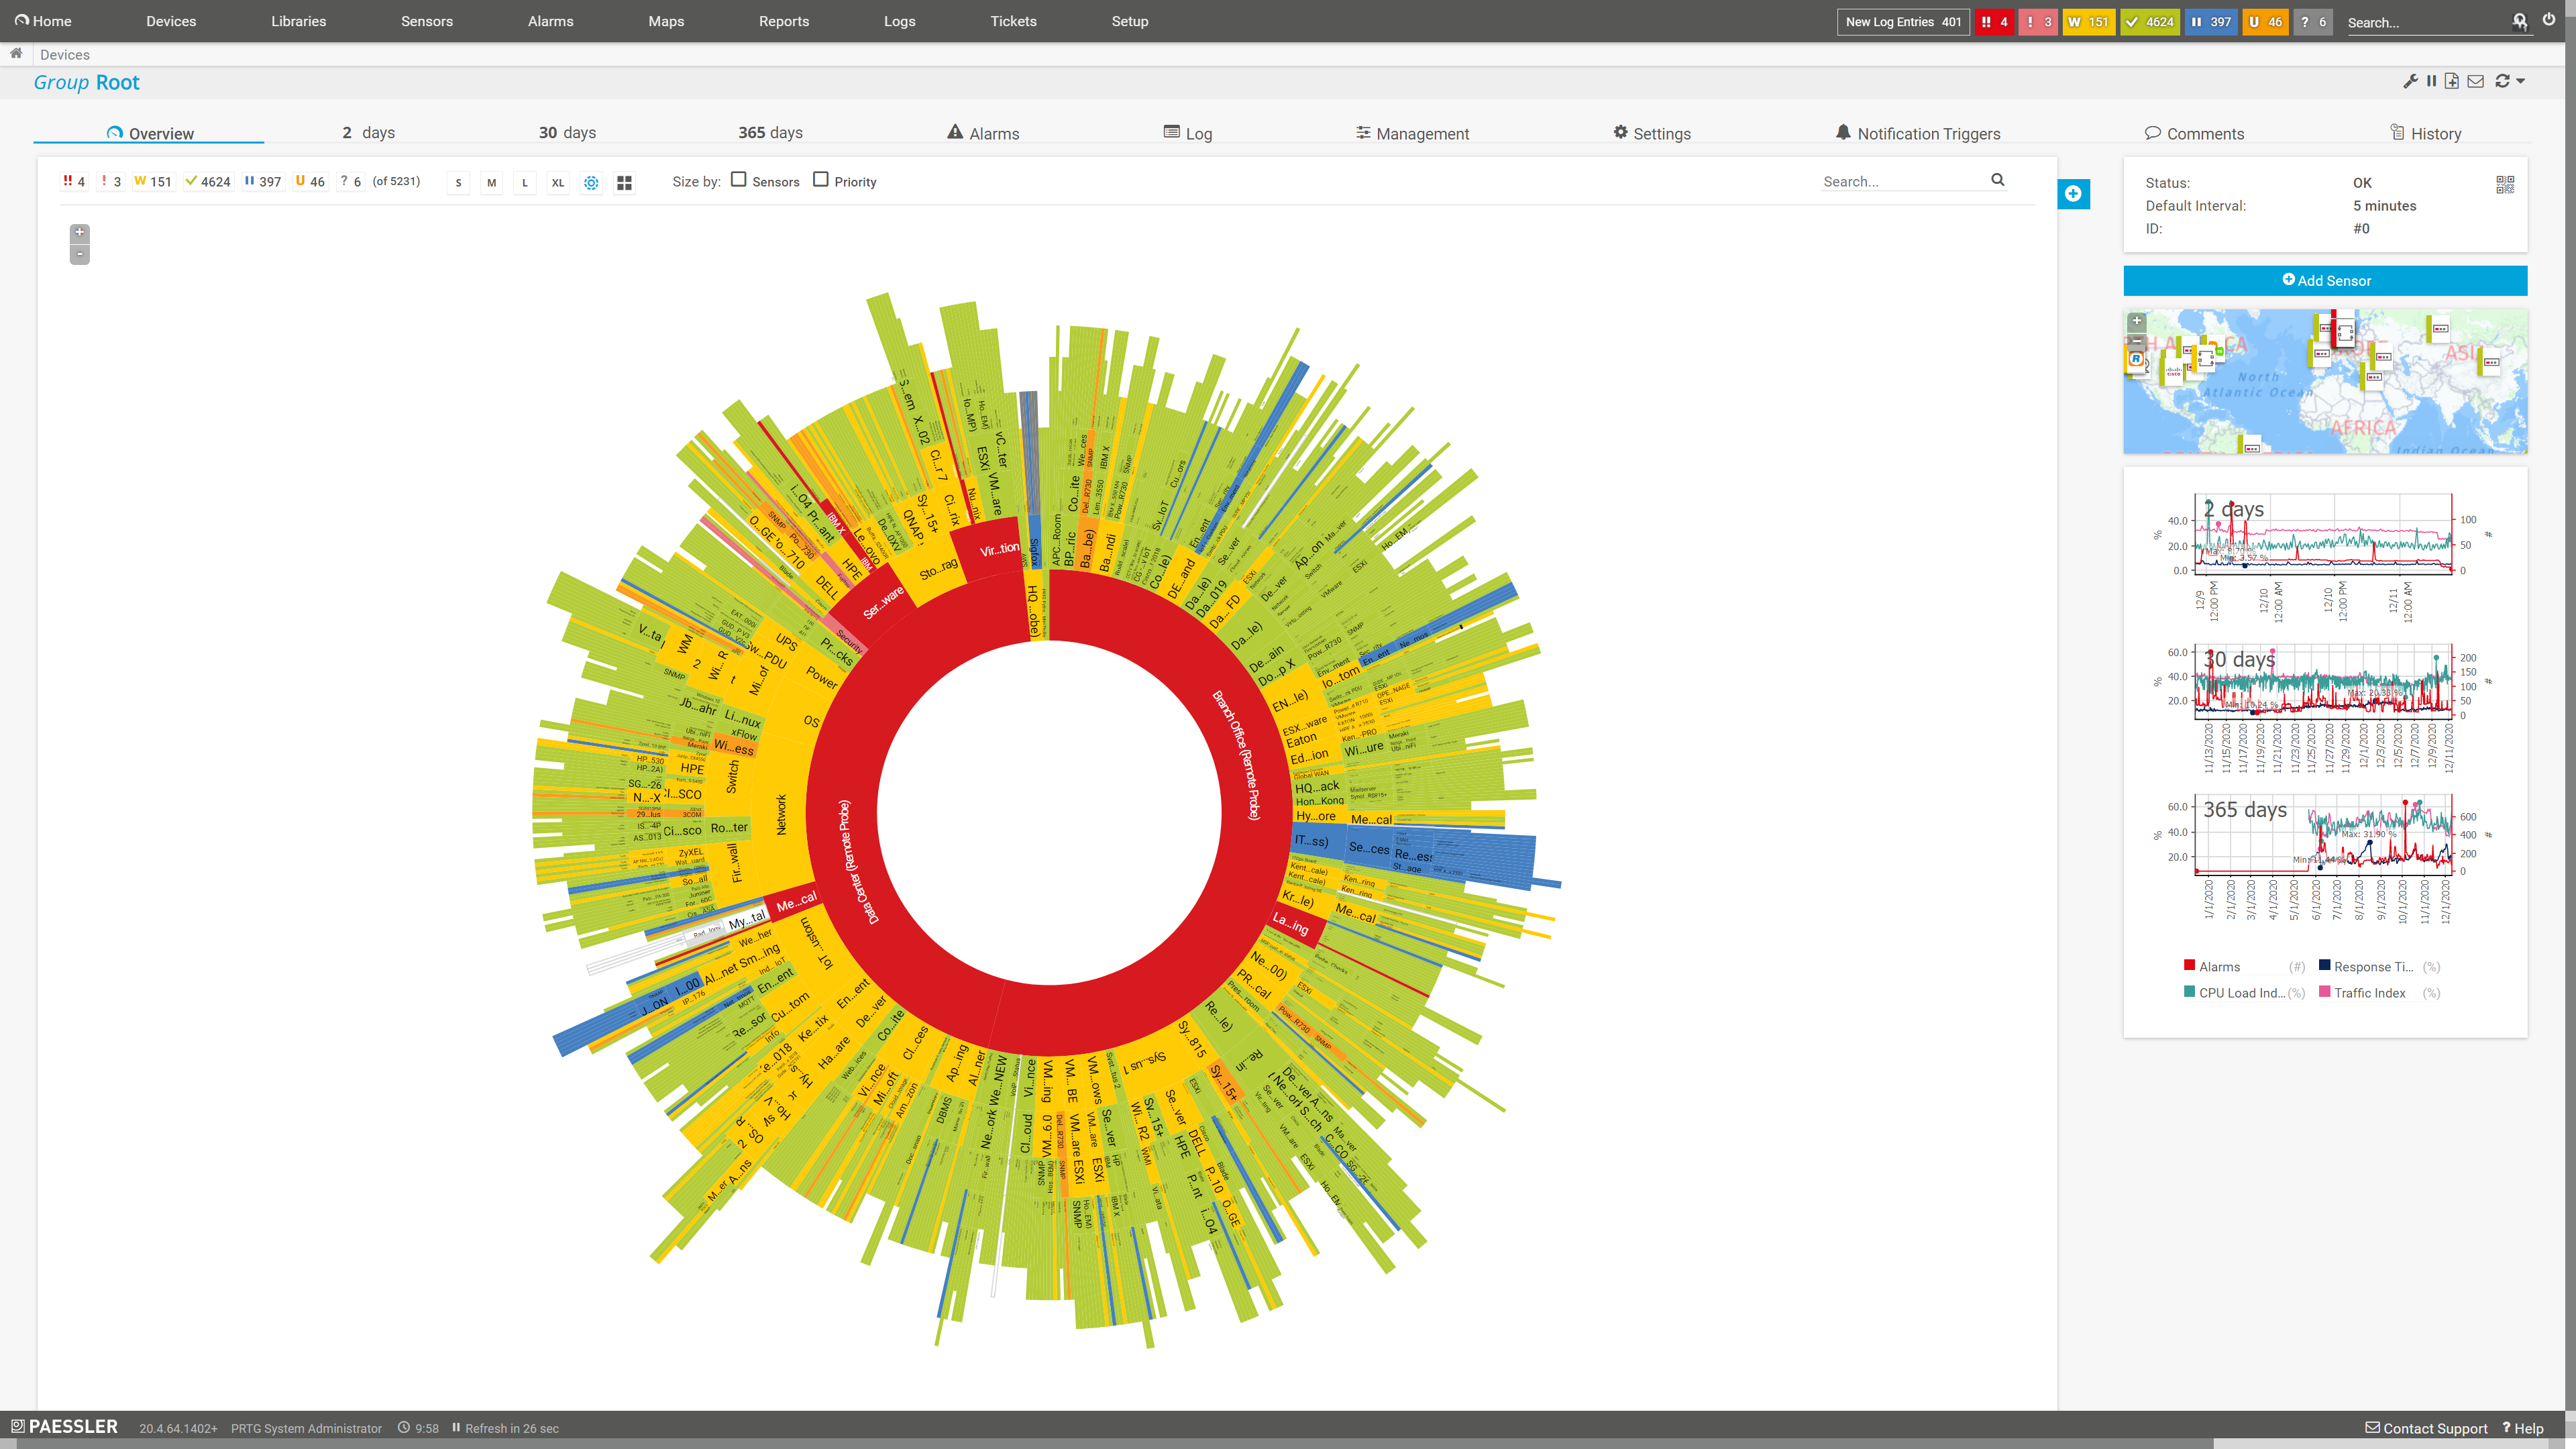
PRTG Sunburst view
Start monitoring your server hardware with PRTG and see how it can make your network more reliable and your job easier.
3 more reasons why to use PRTG as your server monitoring tool
Detect server hardware malfunctions at once
CPU errors, memory overloads, faulty network cards...it seems like something is always going wrong with server hardware. In reality, this is normal wear and tear, particularly if your IT infrastructure grows and incorporates more and more network devices that are not always produced by the same manufacturer. PRTG has got you covered – our server monitoring solution comes with preconfigured sensors for the most popular server hardware manufacturers.
Quickly eliminate server bottlenecks
Even brief traffic spikes can generate peak loads in your IT infrastructure, which can cause any part of the network to go down. Most of the time, it’s your switches, routers, or servers that take the hit. Thanks to our customizable dashboards and easy-to-read graphs, you can see at one glance where a bottleneck is about to occur and take immediate action to troubleshoot the issue – before something more critical happens.
Keep an eye on your virtual servers
Many companies use both physical and virtual servers. However, it’s not enough to only monitor your physical servers – you should also constantly monitor the health and performance of your virtual servers in addition to the host hardware that runs your virtual machines. PRTG comes with various preconfigured sensors from different vendors for monitoring your virtual environment, for example, VMware, Citrix, or Microsoft Hyper-V.
Server monitoring tools put to the test: Prices, features, and more
These days, system administrators are spoiled for choice. The market is literally overflowing with monitoring tools and each of these tools has its pros and cons. We’ve compared some of them with PRTG.
Nagios
Nagios is open-source software for network monitoring. Many of our customers used Nagios before switching to PRTG because it is free of charge.
Compared to PRTG, however, it is much more difficult to configure. PRTG also beats Nagios when it comes to the visual presentation of data. For a more detailed comparison, see: Nagios vs. PRTG.
SolarWinds
Like PRTG Network Monitor, SolarWinds NPM is proprietary network monitoring software that also monitors server hardware.
While one license of PRTG includes all monitoring features, however, you need different products from SolarWinds to monitor, for example, network traffic or application performance. For a more detailed comparison, see: SolarWinds vs. PRTG.
Zabbix
Zabbix is another free, open-source network monitoring tool that offers more visualization options than Nagios.
If you think about choosing between Zabbix and PRTG, always keep in mind the time that you'll need for extensive configuration work, which you won't need with our easy-to-use monitoring software PRTG. For a more detailed comparison, see: Zabbix vs. PRTG.
PRTG is compatible with all major vendors, products, and systems
![]()
Find the root cause of the problem with our PRTG server monitoring solution
Real-time notifications mean faster troubleshooting so that you can act before more serious issues occur.
Your server monitoring software at a glance – even on the go
Set up PRTG in minutes and use it on almost any mobile device.


Create innovative solutions with Paessler’s partners
Partnering with innovative vendors, Paessler unleashes synergies to create
new and additional benefits for joined customers.


Practical tip: “Hey Heather, why should I monitor the availability
of my servers?”
“If your servers are available, then that means your services usually are too. By providing for end-to-end server monitoring, PRTG Network Monitor increases the uptime and reliability of your business. PRTG is fantastic. It’s an all-in-one professional server availability monitoring tool that monitors everything from your hardware platform to critical services and the business processes that run on your Windows servers.”
Heather Pacan is a lead systems engineer at Paessler
PRTG makes server infrastructure monitoring as easy as it gets
Custom alerts and data visualization let you quickly identify and prevent hard disk health, server performance, and storage issues.
Monitor server availability: FAQ
What types of servers can PRTG monitor?
PRTG can monitor various types of servers including web servers, SQL servers, file servers, mail servers, and virtual servers across different platforms such as Windows, Linux, and macOS.
Can PRTG monitor cloud-based servers?
Yes, PRTG can monitor servers hosted on cloud platforms such as Amazon AWS, Microsoft Azure, and Google Cloud. This includes virtual machines, cloud storage, and other cloud services.
Can PRTG predict server failures?
PRTG can help predict server failures by monitoring trends and performance metrics like CPU load, memory usage, and disk space. If these metrics show unusual patterns, it could indicate a potential issue, allowing administrators to intervene before an actual failure occurs.
What’s included in the free edition of PRTG?
With our free network monitoring tool, you get:
- A freeware monitoring solution for up to 100 sensors for life
- Monitoring of hardware, software, network performance, data traffic included
- Free alerting, reporting, ticketing, and network mapping features
With the freeware edition of PRTG, you can get started with network monitoring in a matter of minutes. Our auto-discovery function detects all network devices within a given IP address range and automatically incorporates them into your monitoring environment.
What is a sensor in PRTG?
In PRTG, “sensors” are the basic monitoring elements. One sensor usually monitors one measured value in your network, for example the traffic of a switch port, the CPU load of a server, or the free space on a disk drive.
On average, you need about 5-10 sensors per device or one sensor per switch port.

PRTG: The multi-tool for sysadmins
Adapt PRTG individually and dynamically to your needs and rely on a strong API:- HTTP API: Access monitoring data and manipulate monitoring objects via HTTP requests
- Custom sensors: Create your own PRTG sensors for customized monitoring
- Custom notifications: Create your own notifications and send action triggers to external systems
- REST Custom sensor: Monitor almost everything that provides data in XML or JSON format
We asked: would you recommend PRTG?
Over 95% of our customers say yes!
Paessler conducted trials in over 600 IT departments worldwide to tune its network monitoring software closer to the needs of sysadmins.
The result of the survey: over 95% of the participants would recommend PRTG – or already have.

Paessler PRTG is used by companies of all sizes. Sysadmins love PRTG because it makes their job a whole lot easier. Bandwidth, servers, virtual environments, websites, VoIP services – PRTG keeps an eye on your entire network. Everyone has different monitoring needs. That’s why we let you try PRTG for free.Still not convinced?
![]()
More than 500,000
sysadmins love PRTG![]()
Monitor your entire IT infrastructure
![]()
Try Paessler PRTG
for free
![]()
Start monitoring your servers with PRTG and see how it can make your network more reliable and your job easier.
|
PRTG |
Network Monitoring Software - Version 25.1.102.1373 (January 9th, 2025) |
|
Hosting |
Download for Windows and cloud-based version PRTG Hosted Monitor available |
Languages |
English, German, Spanish, French, Portuguese, Dutch, Russian, Japanese, and Simplified Chinese |
Pricing |
Up to 100 sensors for free (Price List) |
Unified Monitoring |
Network devices, bandwidth, servers, applications, virtual environments, remote systems, IoT, and more |
Supported Vendors & Applications |
|
Discover more monitoring insights and stories


Combining the broad monitoring feature set of PRTG with IP Fabric’s automated network assurance creates a new level of network visibility and reliability.