![]()
IIS monitoring with PRTG
Keep a 24/7 eye on your web servers, applications, and websites
- Receive customizable alerts and notifications in real time
- Secure the performance of your web pages and web transactions
- Choose between out-of-the-box and custom IIS sensors
Our users give top ratings for monitoring with Paessler PRTG


PRTG IIS monitoring: What you’ll find on this page

- Why IIS Monitoring with PRTG is important
- 4 ways PRTG makes IIS monitoring more effective
- What IIS performance monitoring looks like in PRTG
- 3 more reasons why to choose PRTG as your IIS monitoring tool
- Explore our preconfigured PRTG sensors for IIS monitoring
- Monitoring Internet Information Services: FAQ
Why IIS monitoring with PRTG is important
Most companies depend on a high-performing, always available website, whether it means sales, customer acquisition, or customer care. No company can afford long response times or failures of its internet presence without risking serious losses.
IIS monitoring with Paessler PRTG helps secure your company website’s optimal performance by detecting malfunctions and warning you quickly so you can eliminate the problem and avoid costly downtime.
PRTG makes Microsoft IIS monitoring as easy as it gets
Custom alerts and data visualization let you quickly identify and prevent IIS application and web server issues.
4 ways PRTG makes IIS monitoring more effective
Beyond website loading time
A ping to the website measures its response time – however, this does not necessarily indicate anything vital about the actual user experience.
PRTG monitors far more, such as the loading time of the source code or even the complete website including all content. It can also simulate logon or purchase processes.
Global web server monitoring
If your company operates internationally, accessibility of an IIS web server in the U.S. does not mean that customers from Europe or Asia have fast access.
PRTG allows monitoring of the web page from globally distributed locations. This goes beyond informing you that something is wrong and helps you figure out what is not working properly.
One solution to monitor everything
Many applications, such as IIS web servers and databases, also have a great impact on the performance of a website.
PRTG monitors everything at a glance – from web application performance to the health and availability of the underlying server hardware to load balancers that control data streams.
Avoid problems before they occur
With "classic" web page monitoring, the problem occurs and then you have to search for the cause of the problem. But PRTG reverses that.
Instead of reacting to existing problems, it alerts you before problems occur to empower you to proactively address the issue, making it easier to troubleshoot and saving costs.
What IIS performance monitoring looks like in PRTG
Diagnose network issues by continuously tracking the availability and performance of IIS web servers, applications, and IIS logs. Show response times, web service status, CPU usage, execution time, uptime, and other key metrics in real time. Visualize monitoring data in clear graphs and dashboards to identify problems more easily. Gain the overview you need to troubleshoot all issues with Microsoft IIS servers and applications that rely on them.

Device tree view of the complete monitoring setup
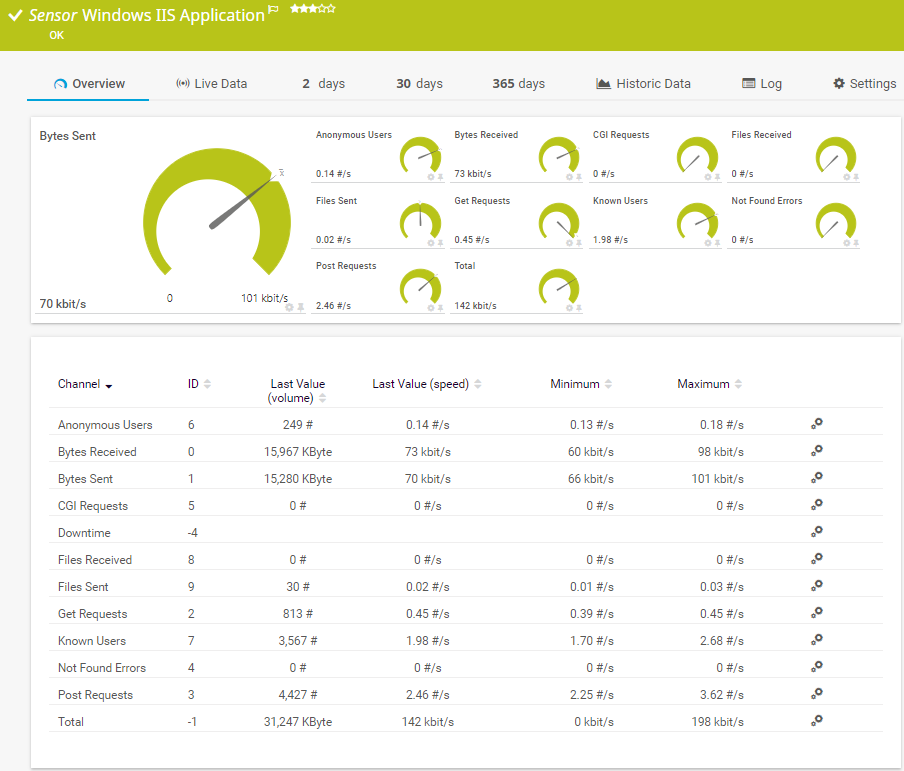
Preconfigured Windows IIS Application sensor in PRTG

Custom PRTG dashboard for keeping an eye on the entire IT infrastructure
Start monitoring IIS servers with PRTG and see how it can make your network more reliable and your job easier.
“All-around winning “The real beauty of PRTG is the endless possibilities it offers” “PRTG Network MonitorIT experts agree: Paessler PRTG is a great solution for IT infrastructure monitoring

network monitor”

is very hard to beat”
3 more reasons why to choose PRTG as your IIS monitoring tool
PRTG includes all functions for direct monitoring of your IIS servers, applications, and website, plus features for monitoring your entire network.
Web monitoring features
- Website monitoring: website availability via ping; loading time for the complete page; transaction monitoring
- Web server monitoring: Microsoft Internet Information Services (IIS), Apache
- Email monitoring
- Windows Performance Counter monitoring: locating network bottlenecks
Network monitoring features
- Out-of-box monitoring of common devices (servers, switches, routers, firewalls, and more)
- Support of standard protocols (SNMP, WMI, NetFlow, packet sniffing, and more)
- Monitoring of virtual environments (VMware, Hyper-V, Citrix) and cloud environments (AWS, Azure)
General monitoring features
- Documented API and templates for the simple creation of custom queries
- Comprehensive alerting functionality with different notification methods (SMS, email, push notification, and more)
- Great visualization options, for example customizable dashboards and maps
- Storage of monitoring data in the original interval for precise long-term evaluations
Your IIS monitor at a glance – even on the go
Set up PRTG in minutes and use it on almost any mobile device.


Find the root cause of the problem with our PRTG IIS monitoring solution
Real-time notifications mean faster troubleshooting so that you can act before more serious issues occur.
PRTG is compatible with all major vendors, products, and systems
![]()
Explore our preconfigured PRTG sensors for IIS monitoring
PRTG comes with more than 250 native sensor types for monitoring your entire on-premises, cloud, and hybrid cloud environment out of the box. Check out some examples below!
Windows IIS Application
The Windows IIS Application sensor monitors a Microsoft Internet Information Services (IIS) server via Windows Management Instrumentation (WMI). It can also monitor applications that use IIS, such as Microsoft SharePoint or Microsoft Reporting Services (SSRS). It can show the following and more:
- Number of anonymous and known users
- Number of bytes and files sent and received
- Number of CGI, GET, and POST requests
- Web service status
- Uptime
PerfCounter IIS Application Pool
The PerfCounter IIS Application Pool sensor monitors a Microsoft Internet Information Services (IIS) application pool via Windows performance counters. It can show the following:
- Overall application pool status
- Number of failures in worker processes
- Number of failures in worker process pings, startups, and shutdowns
- Number of worker processes
WMI Service
The WMI Service sensor monitors a Windows service. It can show the following:
- CPU usage
- Number of handles and threads
- Pagefile usage
- Execution time of the monitoring request
- Working set
SNMP Windows Service
The SNMP Windows Service sensor monitors a Windows service. It can show the following:
- Downtime
- Operating state
Create innovative solutions with Paessler’s partners
Partnering with innovative vendors, Paessler unleashes synergies to create
new and additional benefits for joined customers.


With ScriptRunner, Paessler integrates a powerful event automation platform into PRTG Network Monitor.
ScriptRunner
“Excellent tool for detailed monitoring. Alarms and notifications work greatly. Equipment addition is straight forward and server initial setup is very easy. ...feel safe to purchase it if you intend to monitor a large networking landscape.”
Infrastructure and Operations Engineer in the Communications Industry, firm size 10B - 30B USD
PRTG makes Microsoft IIS monitoring as easy as it gets
Custom alerts and data visualization let you quickly identify and prevent IIS application and web server issues.
Monitoring Internet Information Services: FAQ
What is IIS?
IIS, or Internet Information Services, is a flexible, secure, and manageable web server developed by Microsoft. It is used to host websites, services, and applications on the Windows operating system. IIS supports various protocols, including HTTP, HTTPS, FTP, FTPS, SMTP, and NNTP, making it a versatile platform for web hosting and communication. Typical use cases include hosting static and dynamic websites, running web APIs and microservices, providing content delivery for applications, enabling secure file transfers via FTP/FTPS, and supporting enterprise applications, including SharePoint and Microsoft Exchange.
What is IIS monitoring?
IIS monitoring refers to the process of observing, analyzing, and managing the performance, availability, and health of an Internet Information Services (IIS) web server and the applications it hosts. Monitoring IIS helps ensure that websites and services are running efficiently, errors are minimized, and potential issues are detected before they impact users. Key aspects of IIS monitoring include:
- CPU and memory usage: Monitors how much system resources IIS processes consume
- Request processing time: Measures how long it takes to process HTTP requests
- Network throughput: Tracks data sent and received, which indicates traffic levels
- Worker processes (w3wp.exe): Monitors the health and behavior of IIS worker processes
- Error rates: Keeps track of HTTP error codes (e.g., 404, 500).
- Request queues: Measures the number of requests waiting to be processed
- Availability: Monitors whether websites and applications are up and responsive
- Transactions: Uses synthetic transactions to simulate user behavior and measure response times
- Security: Monitors SSL/TLS certificate validity and encryption settings
Why should I monitor IIS?
Regular IIS monitoring is essential for maintaining the reliability and effectiveness of web applications hosted on IIS servers:
- Proactive issue detection: Identifies problems before they impact users
- Optimized performance: Helps fine-tune server and application performance
- Improved availability: Minimizes downtime and ensures high availability
- Enhanced security: Detects suspicious activity and potential vulnerabilities
- Insightful reporting: Provides data for capacity planning and performance optimization
What is a sensor in PRTG?
In PRTG, “sensors” are the basic monitoring elements. One sensor usually monitors one measured value in your network, for example the traffic of a switch port, the CPU load of a server, or the free space on a disk drive.
On average, you need about 5-10 sensors per device or one sensor per switch port.

PRTG: The multi-tool for sysadmins
Adapt PRTG individually and dynamically to your needs and rely on a strong API:- HTTP API: Access monitoring data and manipulate monitoring objects via HTTP requests
- Custom sensors: Create your own PRTG sensors for customized monitoring
- Custom notifications: Create your own notifications and send action triggers to external systems
- REST Custom sensor: Monitor almost everything that provides data in XML or JSON format
Paessler conducted trials in over 600 IT departments worldwide to tune its network monitoring software closer to the needs of sysadmins. We asked: would you recommend PRTG?
Over 95% of our customers say yes!
The result of the survey: over 95% of the participants would recommend PRTG – or already have.
Paessler PRTG is used by companies of all sizes. Sysadmins love PRTG because it makes their job a whole lot easier. Bandwidth, servers, virtual environments, websites, VoIP services – PRTG keeps an eye on your entire network. Everyone has different monitoring needs. That’s why we let you try PRTG for free.Still not convinced?
![]()
More than 500,000
sysadmins love PRTG![]()
Monitor your entire IT infrastructure
![]()
Try Paessler PRTG
for free
![]()
Start monitoring IIS servers with PRTG and see how it can make your network more reliable and your job easier.
|
PRTG |
Network Monitoring Software - Version 25.1.102.1373 (January 9th, 2025) |
|
Hosting |
Download for Windows and cloud-based version PRTG Hosted Monitor available |
Languages |
English, German, Spanish, French, Portuguese, Dutch, Russian, Japanese, and Simplified Chinese |
Pricing |
Up to 100 sensors for free (Price List) |
Unified Monitoring |
Network devices, bandwidth, servers, applications, virtual environments, remote systems, IoT, and more |
Supported Vendors & Applications |
|
Discover more monitoring insights and stories

Solutions for all your monitoring needs


Combining the broad monitoring feature set of PRTG with IP Fabric’s automated network assurance creates a new level of network visibility and reliability.